
When we are coding, there are always some potential mistakes or errors. Even though we look back to the codes, we still may not be able to find them. In this case, a debugger is very useful. A debugger is a tool that help us test or debugger our programs ideally line by line. The main use of a debugger is to run the target program under controlled conditions that permit the programmer to track its execution and monitor changes in computer resources that may indicate malfunctioning code.
IDE Debugger
When we are using an Integrated Development Environment (IDE) like VScode, or PyCharm, it will be convenient to use a debugger in an IDE. For example in PyCharm, the user interface looks like:
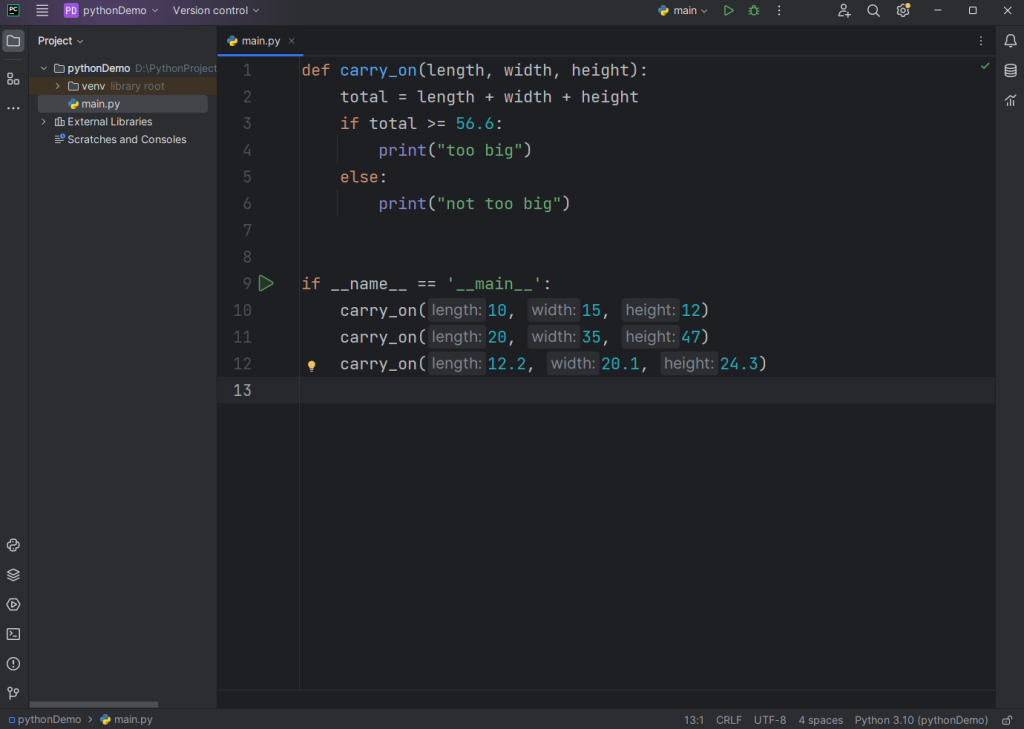
We can click the green triangle button to run the program. The output of this program is:
not too big
too big
not too big
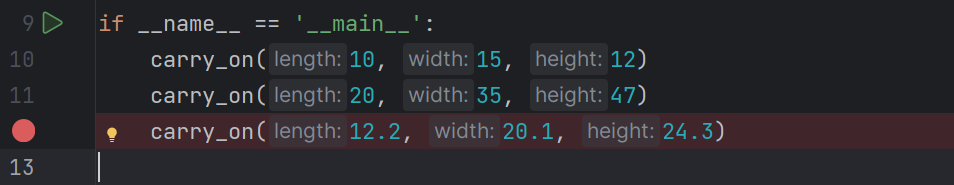
In this case, the line 12 should print “too big” because 12.2+20.1+24.3=56.6. But we get an unexpected output, and we would like to see what happened behind the scenes. In PyCharm, we can click the line number to create a breakpoint. There will be a red dot on the line number and the whole line will be highlighted in red.
Then we can click the green debugger button (![]() ) right next to the run button. The program will run and hold on the line that we set a breakpoint. The debugger console will look like:
) right next to the run button. The program will run and hold on the line that we set a breakpoint. The debugger console will look like:
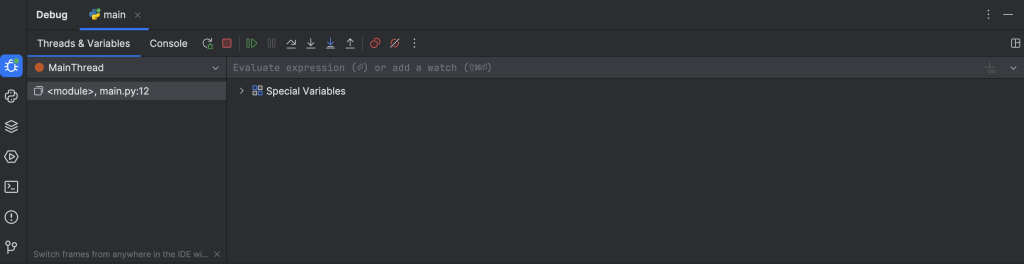
The program won’t run until we click any buttons.
Common used bottons:
 : used to rerun, the program will run again and hold on the line has a breakpoint.
 : used for stopping the program.
 : used to continue and run the program as usual.
 : used to step over a line. The line of code will be executed without step in any functions.
 : used to step into a line. If there is a function call, the debugger will step in the function.
 : used to steo out from a function call.
In this case, we can click the step into button to step into function call (carry_on(12.2, 20.1, 24.3)). After calculating the total, we can see the change of every variable in the variables window.
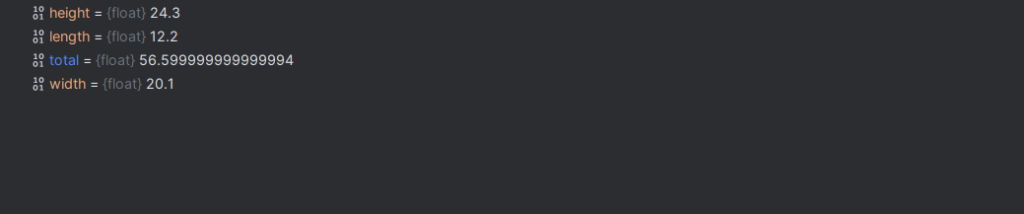
Here we can see, the value of total is actuall 56.599999999999994 instead of 56.6. So we can use the round() function to round this number to 56.6 and fix this problem.
PDB module
In Python, there is another tool specifically designed for debugging called the “pdb” module or the Python DeBugger. There’s more than one way to use the pdb module. We can, like all modules, import it. Or instead, we can simply use the built-in breakpoint() function to trigger the python debugger automatically at that point in the code.
When the python debugger is active, we can enter commands into the debugger environment to inspect our code as it runs.
Common commands:
- s = execute on step of the code
- n = execute the next line of code (even if it involves multiple steps, the whole line will be executed), just like step over
- c = continue until the end or an error occurs
- p = print something that we would like to see
- h = stands for “help”, h[<something>] will give us help on something
Sometimes we don’t even have to have a breakpoint necessarily, we can simply import pdb and if an error occurs, enter “pdb.pm()” into the console and we can enter pgb’s post-mortem envirnment to inspect the state of the code at the time of error.